Archive for the ‘Trade Statistics’ Category

DPRK-Russia ties expanding

Thursday, July 3rd, 2014

According to Yonhap:

Cross-border trade between North Korea and Russia jumped 37 percent to US$104 million in 2013 from the $76 million recorded in the previous year, according to a report by Lee Yong-hwa, a researcher at the private think tank Hyundai Research Institute.

“The North is believed to have forged deeper relations with Russia in an effort to revitalize its economy and prevent it from becoming excessively dependent on China,” Lee said in the report.

The researcher said the two countries’ economic cooperation is forecast to grow further going forward as the North’s attempts to revitalize its moribund economy coincide with Russia’s bid to develop its Far Eastern regions.

According to the report, the portion of trade between North Korea and Far Eastern Russia out of the two nations’ total trade volume surged to 23.1 percent in 2013 from the 10 percent tallied in 2009, indicating that Russia’s Far East development policies have added to the overall bilateral trade expansion.

The socialist country has also tightened relations with Russia in other business areas including transportation and logistics as well as in the energy industry, the report added.

China was the biggest trading partner for North Korea last year with their bilateral trade volume reaching $6.54 billion, according to data from the Korea International Trade Association (KITA).

But trade between the two Koreas fell to its lowest level in eight years in 2013 due to their strained relations. Inter-Korean trade reached $1.15 billion last year, down a whopping 41.9 percent from the previous year’s $1.98 billion, the data showed.

Read the full story here:
Russia-N. Korea economic ties expanding: report
Yonhap
2014-7-3

Share

Bank of Korea on DPRK economy in 2013

Friday, June 27th, 2014

The South Korean central bank, the Bank of Korea, publishes an annual summary of the DPRK’s economic performance the previous year. The 2013 report is out. You can also download it on my DPRK Economic Statistics Page.

Here is a summary in Yonhap:

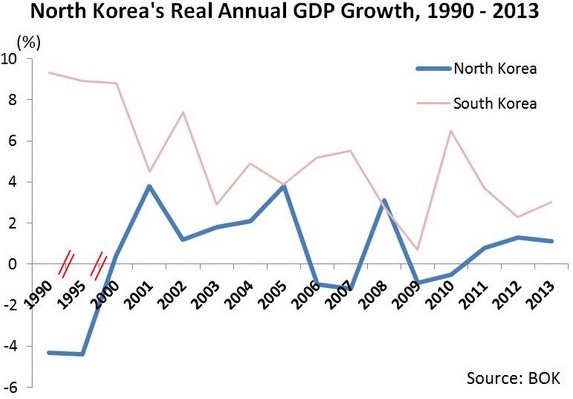
The Bank of Korea (BOK) estimated that the country’s economy expanded 1.1 percent in 2013, slowing from a 1.3 percent on-year expansion in the previous year.

In 2012, the North Korean economy was estimated to have grown at the fastest pace in four years, after contracting 0.9 percent and 0.5 percent in 2009 and 2010, respectively.

A BOK official explained that while the North’s construction sector shrank last year, its agricultural output improved on favorable weather conditions.

An expansion in production of coal and iron ore also lent support to growth, the official added.

Pyongyang’s construction industry contracted 1 percent on-year, compared with a 1.6 percent decline in 2012, as an increase in the number of residential buildings failed to offset falling demand for road construction works.

Its agricultural and fishery industry, which accounts for 22.4 percent of its total output, expanded 1.9 percent last year, slowing from a 3.9 percent growth in 2012.

Growth in its mining and manufacturing industries, which account for 35.7 percent of overall output, gained traction to reach 1.5 percent, up from 1.3 percent a year earlier.

The data, meanwhile, showed that North Korea’s nominal gross national income (GNI) came in at 33.8 trillion won (US$33.3 billion) last year, which is roughly 2.3 percent of South Korea’s 2013 GNI of 1,441.1 trillion won.

The Wall Street Journal’s Korea Real Time notes the following:

“North Korea has neither the capability to collect and analyze all the relevant data necessary to measure its own GDP growth nor the willingness to disclose them to the outside world,” says Mr. Cho.

Marcus Noland published a graph of korean growth rates from 1990-2013 and offered comments on the BOK’s methodology:

Noland-Koreas-GDP-growth-2013

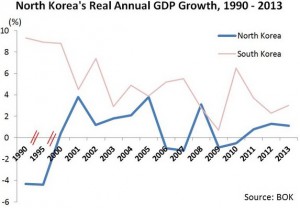
And Noland’s comments:

According to the report, BOK constructs its national income account estimates “using basic data on North Korea’s economic activities supplied by relevant institutions…GDP at current prices is estimated with the use of South Korean prices and value-added ratios.”

What this means in non-economist speak is that someone (the NIS?) gathers data using some sources and methods which presumably put an emphasis on physical indicators that are easily countable. So that, as a practical matter, the South Korean authorities may have a better grasp of output in some sectors (like coal, where it’s easy to count railcars leaving a limited number of mines) and less on say services such as education where both the quantity and quality are more difficult to observe. Not surprisingly, the agricultural and industrial sectors of the economy show more output variability than does services. Whether this reflects reality or just problems counting physical indicators for services is unknown.

Then, having obtained these physical measures of output, we need prices and value-added weights to aggregate them into a single measure of the value of output. According to the BOK report they use South Korean prices and value-added weights. There are two problems here, though one problem may be diminishing over time. The first problem is that the relative price structures of the North and South Korea economies are not the same. However, over time it appears that the structure of domestic prices in both economies is getting more like world prices, and hence more like each other. So differing relative prices is probably less of an issue today than say 20 years ago.

Its less clear that the problem is disappearing with respect to the use of South Korean value-added weights that reflect the underlying techniques of production which remain vastly different across the two economies. Bottom line: we know there are some non-trivial problems with using the South Korean data to construct the North Korean GDP estimates.

Rumors have long circulated that the South Koreans either obtained or constructed a North Korean input-output table which they could use for these calculations, and contrary to the statement in the BOK report, weights derived from this source are used to construct the North Korean national income estimates, not the South Korean value-added weights. I personally do not know whether these claims are true or not.

Here is analysis by the Institute for Far Eastern Studies (IFES) (2014-7-4):

Real GDP of DPRK Grows in 2013, Marking Third Consecutive Year

On June 27, 2014 the Bank of Korea announced that North Korea’s real GDP grew 1.1 percent over the previous year (2013). Despite intense sanctions imposed by the international community, North Korea’s GDP grew by 0.8 percent in 2011 and 1.3 percent in 2012, showing that North Korea has been able to maintain a positive GDP growth rate for three years running.

The Bank of Korea’s “Gross Domestic Product Estimates for North Korea in 2013” report identifies favorable weather as a factor in increased agricultural production and higher crop yields, and points to the expanded production of coal, iron and other mineral resources as the keys to North Korea’s extra 1.1 percent growth.

As for individual sectors, crop production increased by 1.1 percent, the mining industry expanded by 2.1 percent, manufacturing by 1.1 percent, utilities (electricity, gas, water) by 2.3 percent, and the service industry expanded by 0.3 percent. On the other hand, due to a decrease in road construction and other public works projects, the construction sector posted a 1.0 percent decrease despite growth in homebuilding.

According to the Bank of Korea, North Korea’s 2013 gross national income (GNI) was 33.8 trillion won, approximately 1/43 of South Korea’s GNI for the same year. Furthermore, it was reported that North Korea’s GNI per capita in 2013 was 1.379 million won, approximately 1/21 of the GNI per capita of South Korea.

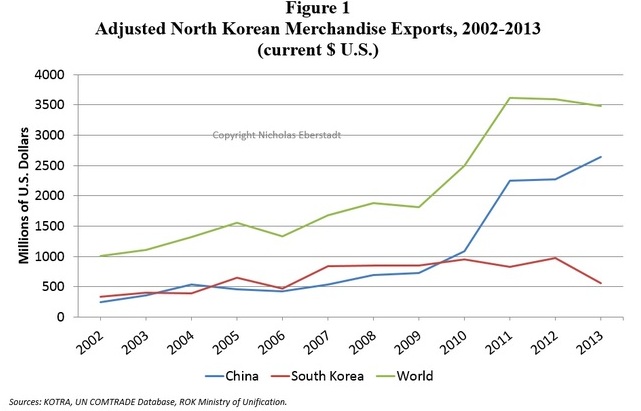
The scale of North Korea’s foreign trade (excluding inter-Korean trade) reached 7.34 billion USD (combined imports and exports) in 2013 — a 530 million USD increase over the previous year.

Exports saw an increase of 11.7 percent compared to 2012, reaching 3.22 billion USD, with exports of minerals and textiles seeing the highest increases of 14.4 percent and 31.2 percent, respectively. Imports in 2013 rose to 4.13 billion USD, an increase of 5 percent. Imports of machinery (-6.4 percent) and mineral production equipment (-3.6 percent) saw decreases, but North Korea saw large increases in textile (20.4 percent) and plastic products (27.5 percent) imports in 2013.

In 2013, the scale of inter-Korean trade decreased by 42.4 percent compared to the previous year, totaling 1.14 billion USD. The suspension of the Kaesong Industrial Complex was responsible for 99.7 percent of the decrease.

The Bank of Korea has estimated North Korean economic growth rates annually since 1991 by acquiring preliminary data through various affiliated agencies related to the North’s economic activities. The System of National Accounts (SNA) of the United Nations is used to estimate North Korean growth from the South.

Share

Data on Kaesong’s cumulative performance

Thursday, June 12th, 2014

According to Yonhap:

Cumulative production of the inter-Korean industrial park has come to US$2.3 billion as the most salient outcome of rapprochement between the Koreas marks its 10th anniversary of operations this week, the unification ministry said Thursday.

The joint factory complex in the North Korean border town of Kaesong opened a decade ago following the first inter-Korean summit meeting in 2000, in which their leaders adopted a joint declaration calling for closer cooperation and exchanges.

On June 14, 2004, a group of 15 South Korean groups signed contracts to operate factories in the then-newly built complex, inaugurating the era of the Kaesong Industrial Complex. In December that year, the joint complex saw its first batch of goods produced in its factories.

In the first full year of operations in 2005, annual output reached $14.9 million before jumping by more than 30-fold to $469.5 million in 2012, according to the unification ministry.

But yearly output nearly halved last year from 2012 after Pyongyang suspended operations of the Kaesong complex for five months from April amid inter-Korean tensions. The figure rose to $168.1 million in the first quarter of this year.

The value of inter-Korean trade through the park came to an accumulated $9.45 billion, according to the ministry.

A total of 940,000 people have visited the inter-Korean economic zone, with 125 South Korean firms currently operating in the complex designed to match deep-pocketed South Korean companies with cheap North Korean labor.

Among the firms, 73, or 58.4 percent, are textile firms, while another 24 firms are machinery or steel makers. The complex is also home to 13 electronics makers and 9 chemicals firms, the ministry noted.

The Kaesong complex also saw the number of North Korean workers grow from around 6,000 in 2005 to 52,000 as of recently, along with monthly salary more than doubling from $50 to more than $130.

Although this story reports salaries of $130, a separate story released just a couple of days ago claims the monthly incomes are just $70. I am not sure why the discrepancy.

Read the full story here:
Cumulative output of Kaesong park reaches US$2.3 bln
Yonhap
2014-6-12

Share

Eberstadt on DPRK Trade

Wednesday, June 4th, 2014

UPDATE 1 (2014-6-12): Witness to Transformation has an update here.

ORIGINAL POST (2014-6-4): Nicholas Eberstadt has written an interesting article on trends in the DPRK’s trade patterns from 2002-2013.

Here is just one graph:

Eberstadt-graph-DPRK-trade-2014-6-4

Read the full article here.

Dr. Eberstadt draws some counter-intuitive conclusions that cannot be observed directly from the published data. You can read all about the published data on the DPRK’s 2013 trade statistics here.

Share

DPRK imports digital televisions

Sunday, May 25th, 2014

According to the Korea Times:

North Korea’s imports of digital television sets from China have more than quadrupled this year, a South Korean trade group said Sunday, amid reports that the country is moving to introduce digital TV broadcasting.

In the first four months of the year, China shipped digital TVs amounting to some US$17.66 million to North Korea, up 338 percent from $4.02 million during the same period last year, according to the Korea International Trade Association.

The figure is the fifth-largest amount for any single item shipped from China to North Korea in the January-April period. Gasoline topped the list.

The North earlier said on a state-run website that it was moving to introduce digital TV broadcasting. The country also asked the U.N. International Telecommunication Union in 2011 for assistance in switching from an analog to a digital broadcasting system.

“The move by the North Korean government to switch to a digital broadcasting system appears to be an effort to win greater public support by showing that the people’s lives are improving,” said Cho Bong-hyun, an analyst at the IBK Economic Research Institute.

Read the full story here:
Trade report says N. Korea importing large number of digital TVs
Korea Times
2014-5-25

Share

DPRK – China Trade 2012-2013 comparison

Thursday, May 22nd, 2014

UPDATE: Here is the original KOTRA report.

ORIGINAL POST: According to Yonhap:

Despite years of international sanctions, North Korea’s overall trade volume reached a new annual high in 2013 due largely to growing shipments to and from its closest ally, China, a South Korean trade agency said Thursday.

The North’s overall trade volume came to US$7.34 billion in 2013, up 7.8 percent from the previous year, according to the state-run Korea Trade-Investment Promotion Agency (KOTRA).

“It is the highest amount since KOTRA began compiling data on North Korea’s annual trade volumes in 1990,” it said in a press release.

The country’s exports jumped 11.7 percent on-year to $3.22 billion, with imports growing 5 percent to $4.12 billion.

Bilateral trade volume between North Korea and China came to $6.54 billion, accounting for 89.1 percent of the North’s overall trade in 2013.

“North Korea’s dependence on China for trade has been increasing steadily since 2005 when its trade volume with China exceeded 50 percent of its overall trade,” KOTRA said.

“In addition, it shows China’s pledge to tighten its customs check on shipments to and from North Korea, in protest of North Korea’s missile launch in December 2012 and a nuclear test in February 2013, did not have any significant effect on North Korea-China trade,” it added.

The large increase in North Korea’s overall exports was attributed to growing shipments of fuel, such as coal, which surged 14.9 percent on-year to $1.43 billion, accounting for 44.4 percent of the country’s total exports.

Out of all energy exports, 97.2 percent were shipped to China.

Russia, another North Korean ally, was the country’s second-largest trading partner in 2013, with bilateral trade volume spiking 37.3 percent to $104 million.

Note, this does not contain South Korea data, which for purely political reasons is counted as inter-Korean (domestic) trade. According to a KIEP presentation by Yoon Deok-ryong, DPRK-ROK trade in 2013 amounted to $1.14b.

Here is what the Institute for Far Eastern Studies had to say:

North Korean Foreign Trade Volume Posts Record High of USD 7.3 Billion in 2013

According to a recent report by the Korea Trade Investment Promotion Agency (KOTRA), foreign trade in North Korea (excluding inter-Korean trade) reached a record high of USD 7.3 billion in 2013, up 7.8 percent from the previous year. The report, released on May 22, 2014, marks the fourth year since South Korea enacted the “May 24 Measures,” suspending all inter-Korean trade and economic cooperation outside of the Kaesong Industrial Complex. KOTRA, a South Korean state-run agency which analyzes North Korea’s foreign trade volume, noted that last year’s figures were the highest ever since they began recording data in 1990.

The report shows that North Korean exports and imports in 2013 both increased compared to the previous year, up 11.7 percent (totaling USD 3.2 billion) and 5 percent (totaling USD 4.1 billion), respectively. KOTRA’s data analysis says that North Korean exports consist mostly of “mineral resources such as coal, iron ore, copper and aluminum,” and noted that “the recent boom of contract manufacturing (toll processing) businesses has led to an increase in textile and clothing exports.” Imports, such as electricity, transport vehicles and grains also saw increases, but North Korea was still able to cut their trade deficit by about USD 20 million, from 1 billion (2012) to 980 million (2013).

North Korea’s largest trading partner is China. The trade volume between the two allies reached a total of USD 6.5 billion in 2013, up 8.9 percent from the previous year. This accounts for 89.1 percent of all of North Korea’s foreign trade, showing increasing dependence on China. Despite Beijing’s partaking in international sanctions against North Korea, it appears to have had a little effect on the bilateral trade between the two nations.

North Korea’s other top trading partners behind China include Russia, India, Thailand and Singapore (in that order). In particular, foreign trade with Russia increased by 37.3 percent last year and totaled over USD 100 million (7 million in exports, 97 million in imports). KOTRA explained the sharp increase in Russian imports in the second half of 2013 was due to import of transport vehicles and machineries for the railway construction between the areas of Rajin and Hassan.

KOTRA’s research shows that while the trade with Japan has been nonexistent since 2009, the two nations recently have begun to engage in talks at the bureau-chief level. As expected, due to the economic sanctions imposed on North Korea, foreign trade with the United States remains limited to food, basic necessities, and humanitarian aid.

Coal, lignite and other mineral fuels are North Korea’s largest export products, accounting for 44.4 percent of total foreign exports. This figure increased by nearly 15 percent in 2013, reaching USD 1.4 billion. A staggering 97.2 percent of these mineral exports are sent to China. Other exports such as clothing and textiles saw a 33.5 percent increase from the previous year, totaling USD 520 million. Meanwhile, imports of crude and refined oil – North Korea’s largest import commodities – were recorded at USD 780 million in 2013, a 3.8 percent decrease compared to 2012. North Korea’s oil is imported almost exclusively from China at 94.5 percent.

Despite recent economic sanctions imposed by the international community, North Korea’s foreign trade volume has continued to rise over the last four years thanks to increases in coal, iron and other mineral exports to China. Furthermore, in order to diversify its foreign trade and reduce its trade dependence on China, North Korea likely will continue to further promote bilateral ties with Russia.

Here is coverage in Business Korea.

Aidan Foster-Carter offers this update in the Wall Street Journal’s Korea Real Time.

Nicholas Eberstadt offers analysis here.

Read the full story here:
N. Korea’s overall trade volume grows to record high in 2013
Yonhap
2014-5-22

Share

DPRK trade with Hong Kong in 2013

Thursday, May 1st, 2014

According to Yonhap:

North Korea increased imports of vehicles and alcoholic beverages from Hong Kong in 2013, despite an overall drop in bilateral trade, a South Korean report showed Thursday.

The trade representative office for Korea Trade-Investment Promotion Agency (KOTRA) in Hong Kong said Pyongyang spent US$4.36 million to buy vehicles, up 27.5 percent from the year before, a large number of them with over 3-liter engine and seating capacity for more than 10 people.

Cars were the second-largest single product imported by North Korea from Hong Kong after electronic components, the office said.

“The cars were made in other countries and shipped through Hong Kong,” it said.

North Korean imports of alcoholic beverages shot up 51.3 percent last year from 2012, with whiskey and vodka making up the bulk of products shipped. Though liquor products only accounted for 1.4 percent of goods shipped from the former British colony to Pyongyang, its annual growth rate surpassed that of all others last year.

This trend continued into 2014, with North Korea’s purchase of alcoholic beverages soaring 758.8 percent in January and February vis-a-vis the previous year, according to the KOTRA office.

The latest report showed that two-way trade dropped 57.2 percent on-year to $26.99 million, with Hong Kong’s exports falling 53.7 percent. It said no crude oil, grain and fertilizers were shipped to the North.

Imports from North Korea nosedived 87.9 percent to $770,000.

The report showed that in the first two months of this year, Hong Kong’s exports to North Korea was down 67.9 percent on-year, while imports fell 63 percent.

Read the full story here:
N. Korea increases car, liquor imports from Hong Kong in 2013: report
Yonhap
2014-5-1

Share

DPRK grain imports from China fall

Sunday, April 27th, 2014

We earlier posted an article on how DPRK-China trade has fallen in the first quarter of 2014. The DPRK has apparently imported zero oil from China in the first quarter of this year.

Grain imports from China also fell.

According to Yonhap:

North Korea’s grain imports from China decreased by more than 50 percent in the first quarter from a year earlier, data showed Sunday.

According to the Korea International Trade Association (KITA), North Korea imported 26,263 tons of grain, including 23,636 tons of flour, 1,241 tons of rice and 1,192 tons of corn, from China in the January-March period.

The North’s imports during the first three months is equivalent to 48 percent of 54,178 tons imported during the same period a year ago, the data showed. Compared with the first quarter of 2012, the country’s grain imports from China decreased about 40 percent.

In terms of value, the North’s imports of Chinese grain amounted to US$11.93 million in the first quarter, down 52 percent from $24.71 last year.

“The drop in the North’s grain imports from China in the period compared with other years seems to be due to an increase in the country’s grain production last year,” said Kwon Tae-jin, a research fellow at the government-funded Korea Rural Economic Institute (KREI). “However, the country may increase its grain imports in the future, as the amount of its grain production is not enough for its people.”

The U.N. World Food Program (WFP) estimates the North produced 5.03 million tons of polished grain between November 2013 and October 2014, up 5 percent from a year ago.

Read the full story here:
N. Korea’s grain imports from China halve in Q1
Yonhap
2014-4-27

Share

US trade and aid to DPRK…

Tuesday, April 8th, 2014

According to Yonhap:

U.S. exports to North Korea jumped nearly 20-fold in February from a year earlier, a U.S. radio report said Tuesday.

The volume of trade between the two countries reached US$1.2 million in February, compared with $62,000 a year earlier, the Voice of America (VOA) reported, citing data compiled by the U.S. Commerce Department.

The VOA said that humanitarian assistance provided by U.S. private agencies accounted for 95 percent, or $1.13 million, of the total U.S. shipment to North Korea in February.

The rest of the U.S. exports to the North included poultry, footwear and plastic products, the radio report said.

The U.S., however, imported nothing from North Korea during the cited period, it said.

Read the full story here:
U.S. exports to N. Korea jumps nearly 20-fold in Feb
Yonhap
2014-4-8

Share

DPRK – China trade: What is happening?

Friday, April 4th, 2014

Previous reports indicated that the execution of Jang Song-thaek has to date had little effect on DPRK-China trade. According to the Institute for Far Eastern Studies (2014-3-12):

Trade between North Korea and China in January has increased roughly 16 percent against the previous year. After the December 2013 purge of Jang Song Thaek it was predicted that trade between the two countries would decrease; however, there is no visible sign of this yet.

According to the Korean Foreign Trade Association’s* data, trade between North Korea and China in February increased from 471 million USD to 546 million USD, up 15.9 percent compared to the previous year.

February also showed an increase in anthracite exports, North Korea’s main export to China, rising 21.3 percent to 102 million USD. Iron ore exports also showed a slight increase of 35 million USD compared to last year.

Chinese exports to North Korea, including leading export commodities such as cellular phones and other wireless radio/communication devices, increased 28 percent compared to January of last year, totaling 14.5 million USD. In February, goods exported through China to North Korea increased by 10.2 million USD, a 38.6 percent increase compared to January of last year.

The trade gains in this report are annual for the most part…comparing 2013 data with 2014 data. This reveals little about the change in trade volume from month to month.

Now a story in Yonhap offers January and February 2014 data, and journalists have reached the opposite conclusion. Jang’s execution has played a role in DPRK-China trade. According to the article:

“In January and February this year, North Korea significantly stepped up checks on its coal exports to China,” a source in Beijing said on the condition of anonymity.

“Such reinforced checks appear to be related to the execution of Jang Song-thaek,” the source said.

According to the latest data by the Korea International Trade Association* in Seoul, North Korea’s exports of coal to China in February fell 26 percent from a month ago to 920,000 tons. The North’s exports of iron ore to China also fell 23 percent in February from a month earlier to 197,000 tons.

The North’s total trade with China in February plunged 46 percent from a month earlier to US$255 million, the data showed.

In Dandong, the Chinese border city with North Korea where about 80 percent of bilateral trade is conducted, the flow of goods in and out of North Korea appears to be affected by the execution of Jang.

“In previous years, the North Korean authorities had usually set their annual targets for exports and imports, and given quotas to trading firms,” said another source in Dandong who is doing businesses with North Korea. “But, no quota has been given yet this year.

“Obviously, the mood is different than previous years,” the source said.

No progress has been made on special economic zones, including Hwanggumphyong and Wihwa, set up by the North on the border with China, according to the source.

“Under the current circumstances, Chinese investors will not invest in the North’s special economic zones,” the source said.

Does this mean anything?  Well, we don’t know enough about these numbers, or the cause for such dramatic change in trade patterns, so we will need to continue to watch the data.  Even before the February numbers came out, Scott Snyder reminded us that DPRK-China trade has taken a dip between January and February for each of the last three years!

Snyder-DPRK-China-Trade-2011-2013

Then there are the caveats: 1. This only counts legitimate trade (no illicit, secret, or military trade) 2. No aid 3. No official or unofficial transfers 4. No capital flows.

*Presumably the Korean Foreign Trade Association and the Korea International Trade Association are the same thing.

Read the full Yonhap story here:
N. Korea’s trade with China shaken after Jang’s execution
Yonhap
2014-4-4

Share