UPDATE 1 (2016-12-15): Yonhap reports on some statistics released by Statistics Korea. They largely mirror Bank of Korea data, so I have put the report here:
North Korea’s per capita income was unchanged at 1.39 million won (US$1,179.10) last year, about one twenty-secondth of South Korea’s, government data showed Thursday.
According to data by Statistics Korea, North Korea’s nominal gross national income (GNI) came to 34.5 trillion won in 2015, with its moribund economy contracting 1.1 percent last year.
In comparison, South Korea’s GNI stood at 1,565.8 trillion won last year, roughly 45 times larger than North Korea’s.
North Korea’s population stood at 24.47 million last year, while South Korea had a population of 51.01 million, the data showed.
Mobile phone subscriptions in North Korea were 12.88 per 100 people, while those in South Korea were 118.46 per 100 people, according to the data.
South Korea’s total trade volume was valued at $963.3 billion last year, compared with North Korea’s $6.3 billion.
South Korea’s overall energy output capacity reached 97.64 million kilowatts, 13 times larger than the North’s 7.42 million kilowatts.
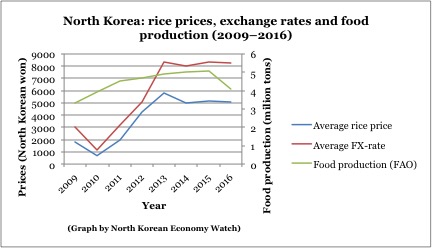
In 2015, Seoul’s total rice production reached 4.32 million tons versus 2.01 million tons for Pyongyang.
The two Koreas also showed significant gaps in social infrastructure.
South Korea’s road network totaled 107,527 kilometers compared with the North’s 26,183 kilometers.
The statistics office has been publishing general information on the North since 1995 as a way of providing insight into the economic and social conditions of the reclusive country.
ORIGINAL POST (2016-7-22): I have added the report to my DPRK Economic Statistics Page. You can download the PDF here.
The Bank of Korea claims the DPRK economy shrank in 2015 by 1.1%
This number has numerous drawbacks which I have discussed before.
According to the Yonhap:
North Korea’s economy is estimated to have contracted 1.1 percent last year amid negative growth in most industries, South Korea’s central bank announced Friday.
The Bank of Korea (BOK) has issued an annual report on the estimated gross domestic product (GDP) of one of the world’s most secretive nations.
It said the communist country’s GDP shrank 1.1 percent in 2015 from a year earlier, the first negative growth since 2010.
The bank cited a drop in crop and mining output by 0.8 percent and 2.6 percent, respectively.
The manufacturing sector suffered a 3.4 percent decline. The electricity, gas and tap water business also tumbled 12.7 percent due to a fall in hydroelectric power production attributable to a drought, according to the BOK.
But the construction field posted a 4.8 percent rise, and the service sector grew 0.8 percent.
The North’s mining and manufacturing industries accounted for 32.7 percent of its GDP, down 1.7 percentage points from 2014.
The BOK put the North’s gross national income (GNI) at 34.5 trillion won ($30.3 billion), 45 times less than that of South Korea. The North has around 25 million residents, half of the South’s population.
The data also showed that the North’s trade volume totaled $6.25 billion, down 17.9 percent on-year.
Exports slipped 14.8 percent to $2.7 billion, and imports shed 20 percent to $3.56 billion.
The North is under heavy U.N.-led economic sanctions for its nuclear and missile activities.
Since no accurate economic data from North Korea are available, the BOK said the statistics are based on estimates using methodologies applied to gauge South Korea’s own economy. Thus, it’s not desirable to directly compare the data with those of other foreign nations, added the bank.
Here is coverage in the Wall Street Journal:
North Korea’s economy likely shrank last year for the first time in five years, South Korea’s central bank said, potentially increasing the ruling challenge for leader Kim Jong Un, who has promised to boost prosperity while confronting the U.S. and other nations with nuclear weapons.
The Bank of Korea said Friday that it estimated North Korean gross domestic product fell 1.1% in 2015, the first decline since 2010 and the largest fall since a 1.2% contraction in 2007.
North Korea doesn’t release official statistics or allow outsiders to make assessments of its economy from within the country. As a result, the BOK’s estimate of North Korean GDP is often cited as the best guess. It bases its calculations on information from Seoul’s spy agency and other authorities that study North Korea.
The biggest recent economic setback for North Korea has come from a sharp fall in the price of coal, its main export product, and a slowdown in China, its sole major trading partner. The South Korean central bank said the North’s external trade was valued at $6.25 billion in 2015—down 18% from a year earlier.
New international sanctions on North Korea following its nuclear bomb test in January this year and long-range rocket launch in February may increase the economic pressure on Pyongyang. For the first time, United Nations sanctions target North Korea’s commodities trade, while the U.S. has sought to cut off Pyongyang’s links to the international financial system.
North Korea insists it will continue to pursue twin policy priorities of nuclear weapons development for its defense while seeking to boost its economy. In his first speech in 2012, Mr. Kim said North Koreans should “not have to tighten their belts again” and has regularly visited economic projects such as factories and farms.
However, output in nearly all North Korean industries contracted last year, including agriculture, fishing, mining and energy, the South Korean central bank said in its report.
Construction was a rare bright spot, growing an estimated 5%, as Mr. Kim has pursued the redevelopment of areas of central Pyongyang, including major new housing projects. The Bank of Korea also estimated a 0.8% increase in service-sector output, reflecting the emergence of unofficial market trading and underground financial services.
The North’s per capita income was around $1,224 in 2015, the bank said, compared with South Korea’s $27,200.
Here is coverage in Reuters:
North Korea’s economy contracted in 2015 at the sharpest pace in eight years, an estimate from the Bank of Korea showed on Friday, as low global commodity prices landed a blow to exports, a key driver for the impoverished country’s economy.
The gross domestic product in North Korea last year fell a real 1.1 percent, South Korea’s central bank said, which was the first fall since 2010 and compares with a 1.0 percent gain in 2014. It also marked the fastest decline since a 1.2 percent drop in 2007.
Isolated North Korea does not publish economic data.
All sectors except construction and services declined, a likely burden for North Korean leader Kim Jong Un already under pressure from international sanctions against multiple provocations including a nuclear test in January.
“The key reason for the GDP contraction looks to be trade as global commodity prices fell while China demand also declined,” said a Bank of Korea official, who declined to be named as he was unauthorized to speak to media.
“North Korea’s main commodity exports are coal and iron ore, which likely all declined last year.”
Neighboring China is North Korea’s chief trading partner.
The Bank of Korea data showed exports in North Korea fell 14.8 percent last year in annual terms as mineral product shipments slumped 14.7 percent. This was far worse than a 1.7 percent decline seen in 2014.
Imports dropped a faster 20.0 percent last year, compared with a 7.8 percent increase in 2014.
The central bank official said trade is expected to worsen this year as it becomes difficult for North Korea to boost shipments with other countries with international sanctions likely to grow heavier following Pyongyang’s continued missile launches and nuclear threats.
Construction rose 4.8 percent last year, accelerating from a 1.4 percent gain in 2014, the same data showed.
Meanwhile, a 0.8 percent gain in services last year reflects North Korea’s economic shift towards capitalism as the black market there has become more pervasive. Financial services have also grown, which likely contributed to the gain, the BOK official added.
The Bank of Korea has released GDP data on North Korea every year since 1991 based on information received from related sources, including the Ministry of Unification.
Here are comments from The Institute for Far Eastern Studies (IFES):
North Korean GDP Dropped Estimated 1.1% in 2015
The Bank of Korea (BOK), South Korea’s central bank, released data on July 22, 2016 indicating that the North Korean economy shrunk by 1.1% in 2015. If this estimate is correct, this would mean that the North Korean economy contracted for the first time since Kim Jong Un came to power in 2012. At the same time, these estimates also indicate that the gap in per capita GDP between North and South Korea widened from 21.3 times in 2014 to 22.2 times in 2015.
The last time North Korea’s annual growth rate was below zero in BOK statistics was five years ago. Back in 2009, it was estimated to be -0.9%, edging up to -0.5% in 2010. However, the last four years have been a time of continued expansion according to the BOK with North Korea’s economy estimated to have grown 0.8% in 2011, 1.3% in 2012, 1.1% in 2013 and 1.0% in 2014. The estimated growth rate for 2015 was the lowest since the -1.2% of 2007.
The BOK’s data indicates that while growth sped up in North Korea’s construction sector in 2015, the performance of the agriculture, fisheries, mining, manufacturing, and public service (electricity, gas and water) sectors was poor.
In the mining sector, declining magnesite and iron ore production resulted in a 2.6% loss of output, while in manufacturing, both light and heavy industrial saw production decline and consequently the sector contracted by an estimated 3.4%.
Output in the public service sector fell by a dramatic 12.7%. The BOK highlighted a drought in 2015 as being a key contributory factor in this regard: reducing hydroelectricity output, as well as exerting a negative influence on steel and machine tool production. At the same time, gains in agricultural and fisheries sector, which had been estimated to be 1.2% in 2014, was partially reversed in 2015, with the sector believed to have contracted by -0.8%. Although output in the livestock and fisheries sector expanded rapidly, this was offset by declines in cereals production including rice and corn due to drought.
Conversely, the construction sector expanded by 4.8% as both output in building and public works-related construction rose. The service sector, principally public services, the wholesale and retail service sector, and communications, grew by an estimated 0.8%.
North Korea’s nominal Gross National Income (GNI) was estimated to be 34.5 trillion South Korean won (KRW), i.e. 2.2% of South Korea’s nominal GNI. Per capita GNI rose to 1.393 million KRW, an increase on the 2014 figure of 1.388 million, but still only 4.5% of South Korea’s per capita GNI.
The gap between North and South Korean per capita GNI rose from 21.3 times in 2014 to 22.2 times 2015. At the same time, combined North Korean commodity imports and exports declined by 17.9% to $6.25 billion (excluding North-South trade) compared to the previous year ($7.61 billion).
The year 2015 saw a decline in the price of minerals, including iron ore, internationally. Reduced demand for North Korean anthracite in China had an impact, with North Korean exports declining to $2.7 billion, a 14.8% decline year-on-year. Textile exports increased by 5.3%, but mineral product exports fell by 14.7%. Income (totaling $3.56 billion), chiefly from mineral products and textiles, thus shrunk by a dramatic 20%.
The difference in the scale of North Korean and South Korean trade volumes rose to 154.1 times in 2015 (an increase from 144.3 times in 2014). At the same time, according to South Korean Ministry of Unification statistics, inter-Korean trade rose by 15.7% year-on-year to $2.71 billion.
Here are comments by Marcus Noland.