By Benjamin Katzeff Silberstein
I wrote about the confusing harvest numbers this past Friday, and I’ve been able to find little new information to make things clearer. Basically, the problem is that talking about “food production” is too vague, since that can mean a lot of different things. In the standard World Food Program/FAO crop assessments, there are usually two numbers quoted: one estimate for total production of food, and one for “milled cereal equivalent”, a standardized measurement used to translate the varying nutritional contents of different crops into a standardized weight measure.* (See below for a more detailed explanation.) Basically, the “milled cereal equivalent” figure tends to be significantly smaller, by about 20 percent or so, than the original, total food production figure.
Since we don’t actually know exactly which number is being thrown around in analyses of the current harvest, I’ve calculated a possible milled-equivalent harvest figure, using the average difference between milled and unmilled for the years where I have the two different numbers from the WFP/FAO crop assessments. None of the historical estimates I’ve found correspond with the harvest numbers for previous years in the 2019 UN Needs and Priorities Plan. Crop production figures are usually given in terms of “marketing years”, not in calendar years. For simplicity’s sake, I denote each year by the second half of the marketing year, when most consumption will occur. So “2019” is the 2018/2019 marketing year, “2018” is the 2017/2018 marketing year, et cetera.
The following shows the scenario where the 4.95 million tonnes production figure is the “unmilled” cereal equivalent measure. Based on the average difference between milled and unmilled for the years where I’ve had data available from UN institutions (0.85 million tonnes), I’ve added and subtracted to complete the figures where necessary. This is not an exact, scientific way of looking at the harvest numbers. For exact accuracy, I’d need to calculate the milled cereal equivalent of each crop, something I don’t have time to do right now. This may well make the figure even lower. (Hazel Smith’s figure, for reference, is 3.2 million tonnes.) But the following does, at the very least, give a sense of the proportions at hand. And it makes the numbers look different from my initial assessment.
| Food production, million tonnes (unmilled) | Food production, million tonnes (milled) | |
| 2009.00 | 4.20 | 3.30 |
| 2010.00 | 5.17 | 4.32 |
| 2011.00 | 5.33 | 4.50 |
| 2012.00 | 5.50 | 4.66 |
| 2013.00 | 5.80 | 4.90 |
| 2014.00 | 5.98 | 5.03 |
| 2015.00 | 5.93 | 5.08 |
| 2016.00 | 5.92 | 5.07 |
| 2017.00 | 6.03 | 5.23 |
| 2018.00 | 5.75 | 5.00 |
| 2019.00 | 4.95 | 4.10 |
Table 1. Figures are sourced from various assessments by the WFP and FAO; contact me for exact sourcing on specific figures.
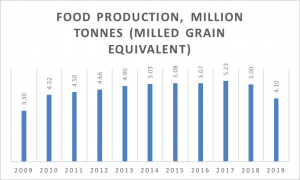
Graphically, the trend in food production in milled terms, i.e. the lower-end, more realistic figure of how much food is available for consumption, using the above assumption for the 2019-figure, looks like this:

Graph 1. Estimate food production in North Korea, million tonnes, in milled cereal equivalent terms.
In short, this does give a rather grim and highly problematic food situation, putting the quantity of the harvest at 4.10 million tonnes. It puts North Korea back to a state of food production prior to 2010–2011, when harvest started to climb. And now, North Korea receives far less aid than it did a decade ago. Plus, its imports will only amount to 200,000 tons, the government seems to be saying, a similar amount to what it procured in imports and humanitarian aid in 2016/2017, when the harvest was much larger.
For long, this is how low North Korean harvests were. Only a few years ago, this would have looked like a rather solid harvest. Looking back in the future, it might turn out that the past few years of food production growth, since around 2011, was an abnormally good period of time. None of this means that this food situation is anything but poor.
To me, among the figures I’ve been able to find, it’s the only one that make sense in the context of the statement from UN representatives that this harvest was the worst “in a decade”. Hopefully things will become clearer over the coming days and weeks, as more information may be published, in which case I’ll update this post.
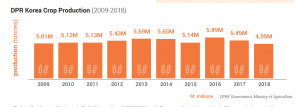
In sum, the actual food available in North Korea is, in all likelihood, much lower than the 4.95 million tonnes-figure quoted by the UN and the North Korean government. As the following graph shows, even using the North Korean government’s figures, the drop from last year doesn’t appear all that massive. But on closer inspection, the actual quantity of food available may be significantly lower than the figure the North Korean government states, as I’ve tried to show in this post.

Graph 2. Food production in North Korea, from the UN’s “2019 Needs and Priorities” report on North Korea.
Finally, a note on the issue of the markets and the public distribution system. I maintain that it’s impossible to get a sense of total food availability and circulation in North Korea as a whole, without taking the markets into account. According to most studies we have, the majority of North Korea’s population rely on these markets, rather than the public distribution system, for their sustenance.
But one has to acknowledge that just like the UN and North Korean government figures may not reflect the whole situation accurately, there may be a fair bit of bias in the data on the prevalence of the markets too. Most of this data comes from surveys done with defectors in South Korea. They overwhelmingly tend to come from the northern provinces of the country, closer to China, where market trade has traditionally been more prolific. Most sources for news from inside North Korea are based in the northern parts of the country, where one can get access to Chinese cell phone network coverage.
There’s likely another form of bias present in these surveys, too. Most people who are reliant on the PDS for their sustenance are likely underrepresented among defectors. People in state administration and security organs, for example, are less likely to leave North Korea, though that of course happens too. And in any case, we’re talking about a quite large demographic of people, whose livelihoods would be significantly impacted by cut rations. Such cuts are already happening, Daily NK reports, with some professional groups receiving only 60 percent of what they otherwise would. The PDS may have changed shape and function quite drastically since the early 2000s, but it may also be more important to the North Korean public than the currently available survey data and reports from inside the country tells us.
Conclusion
North Korea’s food situation, though not at famine-time levels, does appear to be dire. The figures, in combination with reports from inside the country, gives serious cause for concern. Government numbers may not tell the full story since they likely underestimate the role of the markets. Nonetheless, things do look serious. The government could easily alleviate the situation by changing its spending priorities and policies. Chances are that it won’t.
Footnote:
*I’m borrowing here a footnote from a 38 North piece by the late scholar Randall Ireson, whose archive of articles remain one of the best sources for information on North Korean agriculture:
The FAO has consistently used grain equivalent (GE) values for the major crops to compensate for varying moisture and energy content. Thus, husked rice (GE) is .66 of the paddy weight, potatoes (GE) are .25 of the fresh weight, and soybean (GE) is 1.2 times the dry weight because of the high oil and thus calorie content.
