Marcus Noland wrote an op-ed for the BBC which is posted on the Peterson Institute web page. There are some differences in the two (the BBC piece is shorter), so you can read whichever you prefer. Below, however, I have posted the graphs from the Peterson Institute web page with some commentary:
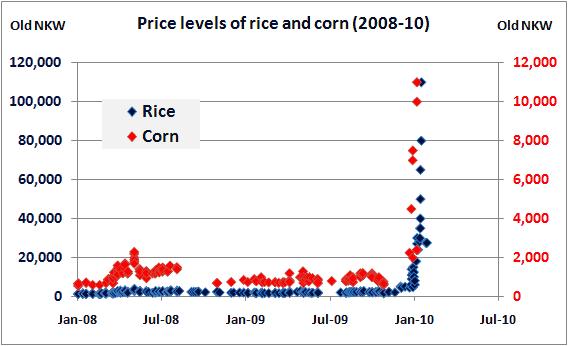
This chart indicates the market for rice was surprisingly efficient before the currency conversion. Over a two year window, the observed price seems remarkably stable (although the scale of the graph makes it hard to see the the actual level of price volatility). Still, it seems fair to say that North Korean rice producers, vendors, and smugglers are quick to spot and eliminate regional price differentials through arbitrage. The supply of rice must also be highly highly elastic. If the North Korean economy was experiencing inflationary pressures in this time, productivity gains and competition would have to have kept the nominal price essentially flat and caused the real price of rice to fall!
The price of corn is somewhat more volatile and I would be interested in hearing theories as to why this is.
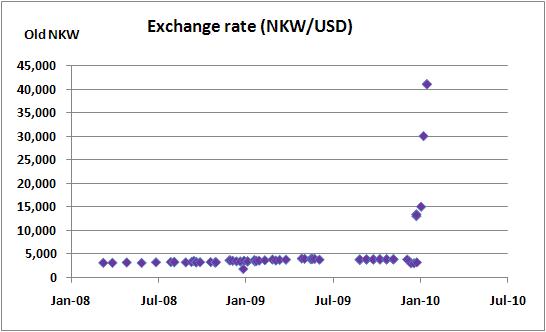
This chart is surprising as well. We see a highly stable US Dollar/DPRK won black market exchange rate (though again, the scale of the graph makes it difficult to determine just how stable). Although the DPRK has not published its monetary policy goals (as far as I am aware), I think it is fair to say that the North Koreans practice exchange rate targeting. Most likely the target is not the US dollar, but the Chinese yuan–which trades at a nearly constant level with the US dollar. Since China is the DPRK’s largest trading partner, it would make sense that the authorities would aim for exchange rate stability. This would suggest, however, that the DPRK’s monetary authorities are well aware of the black market value of their currency and have the tools to affect the exchange rate (i.e. lots of RMB reserves to sell on the black market). I am not sure how plausible this is, but I am not sure how else we can explain this level of exchange rate stability.

The way I read the graph it’s the corn that’s volatile (red dots), and the rice that’s stable (blue dots). Am I misinterpreting the data?
Good eye peter. Fixed. This is what happens when you rush a blog post so you can go to bed.
on that first chart, both the right and left side are labeled “old NKW” I assume that the right is actually new NKW?
I think that the scale on the left is for rice and the scale on the right is for corn.
Can’t it be that corn is more volatile simply because it’s less popular, and thus less liquid?
Read it somewhere that market prices for rice usually fluctuate, too, falling sharply after harvest. (And that it didn’t happen in 2009 due to all kinds of uncertainties.) Raw data might be more useful indeed.